
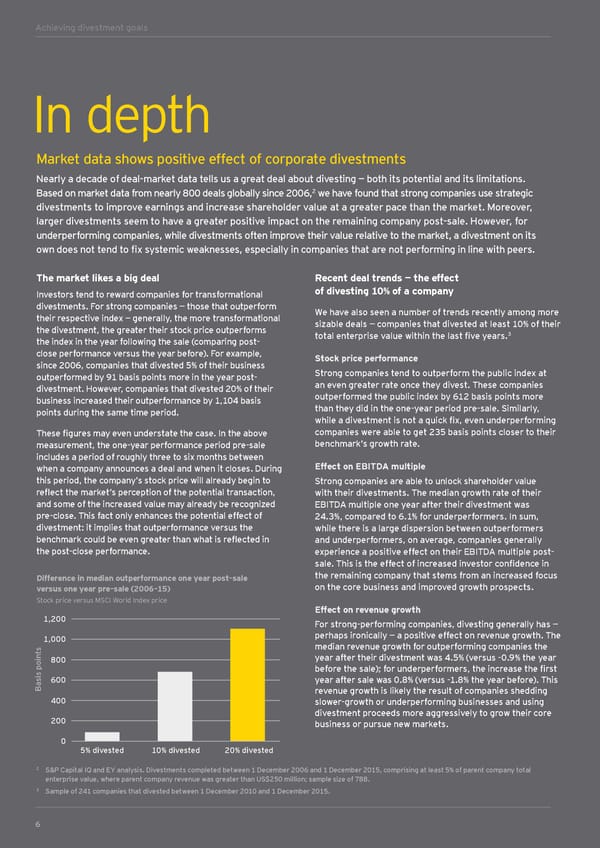
Achieving divestment goals In depth Market data shows positive effect of corporate divestments Nearly a decade of deal-market data tells us a great deal about divesting — both its potential and its limitations. 2 Based on market data from nearly 800 deals globally since 2006, we have found that strong companies use strategic divestments to improve earnings and increase shareholder value at a greater pace than the market. Moreover, larger divestments seem to have a greater positive impact on the remaining company post-sale. However, for underperforming companies, while divestments often improve their value relative to the market, a divestment on its own does not tend to fix systemic weaknesses, especially in companies that are not performing in line with peers. The market likes a big deal Recent deal trends — the effect Investors tend to reward companies for transformational of divesting 10% of a company divestments. For strong companies — those that outperform We have also seen a number of trends recently among more their respective index — generally, the more transformational sizable deals — companies that divested at least 10% of their the divestment, the greater their stock price outperforms total enterprise value within the last five years.3 the index in the year following the sale (comparing post- close performance versus the year before). For example, Stock price performance since 2006, companies that divested 5% of their business Strong companies tend to outperform the public index at outperformed by 91 basis points more in the year post- an even greater rate once they divest. These companies divestment. However, companies that divested 20% of their outperformed the public index by 612 basis points more business increased their outperformance by 1,104 basis than they did in the one-year period pre-sale. Similarly, points during the same time period. while a divestment is not a quick fix, even underperforming These figures may even understate the case. In the above companies were able to get 235 basis points closer to their measurement, the one-year performance period pre-sale benchmark’s growth rate. includes a period of roughly three to six months between when a company announces a deal and when it closes. During Effect on EBITDA multiple this period, the company’s stock price will already begin to Strong companies are able to unlock shareholder value reflect the market’s perception of the potential transaction, with their divestments. The median growth rate of their and some of the increased value may already be recognized EBITDA multiple one year after their divestment was pre-close. This fact only enhances the potential effect of 24.3%, compared to 6.1% for underperformers. In sum, divestment: it implies that outperformance versus the while there is a large dispersion between outperformers benchmark could be even greater than what is reflected in and underperformers, on average, companies generally the post-close performance. experience a positive effect on their EBITDA multiple post- sale. This is the effect of increased investor confidence in Difference in median outperformance one year post-sale the remaining company that stems from an increased focus versus one year pre-sale (2006–15) on the core business and improved growth prospects. Stock price versus MSCI World Index price Effect on revenue growth 1,200 For strong-performing companies, divesting generally has — 1,000 perhaps ironically — a positive effect on revenue growth. The s median revenue growth for outperforming companies the t n year after their divestment was 4.5% (versus -0.9% the year i 800 o before the sale); for underperformers, the increase the first p s i s 600 year after sale was 0.8% (versus -1.8% the year before). This Ba revenue growth is likely the result of companies shedding 400 slower-growth or underperforming businesses and using 200 divestment proceeds more aggressively to grow their core business or pursue new markets. 0 5% divested 10% divested 20% divested 2 S&P Capital IQ and EY analysis. Divestments completed between 1 December 2006 and 1 December 2015, comprising at least 5% of parent company total enterprise value, where parent company revenue was greater than US$250 million; sample size of 788. 3 Sample of 241 companies that divested between 1 December 2010 and 1 December 2015. 6
 Global Corporate Divestment Study Page 5 Page 7