
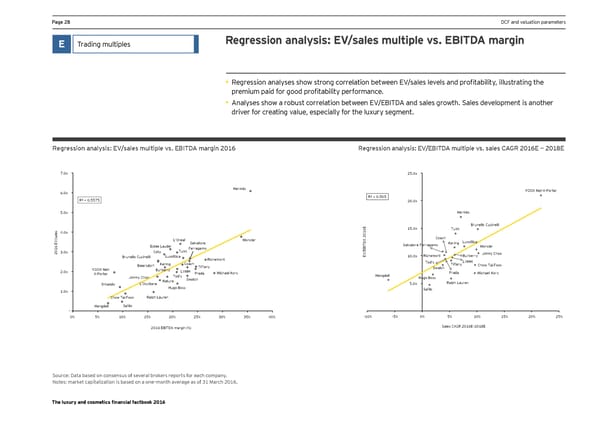
Ha_e *0 DCF and valuation parameters E Trading multiples Regression analysis: EV/sales multiple vs. EBITDA margin • Jegression analqses shoo strong correlation betoeen EN'sales lenels and profitabilitq, illmstrating the premimm paid for good profitabilitq performance. • 9nalqses shoo a robmst correlation betoeen EN'E:AL<9 and sales grooth. Kales denelopment is another driver for creating value, especially for the luxury segment. Je_jessign analysis2 =N'sales emlliple ns& =:AL<9 eaj_in *(). Je_jessign analysis2 =N'=:AL<9 emlliple ns& sales ;9?J *().= È *()0= 7.0x 25.0x Hermès YOOX Net-A-Porter 6.0x R² = 0.5575 R² = 0.505 20.0x 5.0x Hermès E Brunello Cucinelli 6 15.0x Tumi 4.0x 1 0 2 /sales Coach V L'Oréal Moncler A Luxottica Salvatore D Kering T Salvatore Ferragamo Estée Lauder I Moncler Ferragamo B Tumi E 2016 E 3.0x Coty / Jimmy Choo V Richemont Burberry Brunello Cucinelli Luxottica E 10.0x Richemont Tod's LVMH Beiersdorf Kering Coach Tiffany Tiffany Chow Tai Fook YOOX Net- Burberry LVMH Swatch 2.0x A-Porter Prada Michael Kors Prada Michael Kors Jimmy Choo Tod's Hengdeli Hugo Boss Natura Swatch Ralph Lauren Shiseido L'Occitane 5.0x Hugo Boss Safilo 1.0x Chow Tai Fook Ralph Lauren Hengdeli Safilo - 0% 5% 10% 15% 20% 25% 30% 35% 40% -10% -5% 0% 5% 10% 15% 20% 25% 2016 EBITDA margin (%) Sales CAGR 2016E–2018E Source: Data based on consensus of several brokers reports for each company. Notes: market capitalization is based on a one–month average as of 31 March 2016. The luxury and cosmetics financial factbook 2016
 Luxury and Cosmetic Financial Factbook Page 29 Page 31