
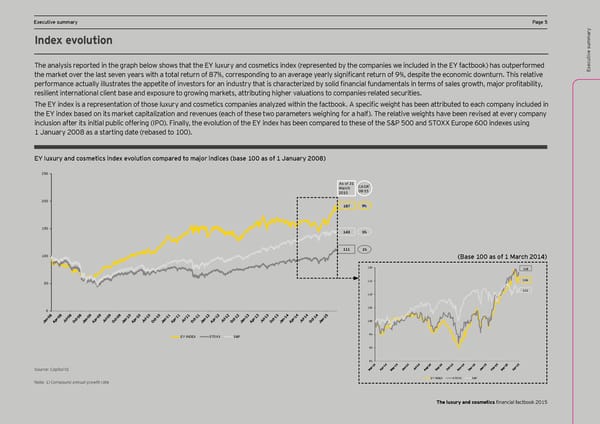
Executive summary Page 5 Index evolution e summary utiv The analysis reported in the graph below shows that the EY luxury and cosmetics index (represented by the companies we included in the EY factbook) has outperformed ec the market over the last seven years with a total return of 87%, corresponding to an average yearly significant return of 9%, despite the economic downturn. This relative Ex performance actually illustrates the appetite of investors for an industry that is characterized by solid financial fundamentals in terms of sales growth, major profitability, resilient international client base and exposure to growing markets, attributing higher valuations to companies-related securities. The EY index is a representation of those luxury and cosmetics companies analyzed within the factbook. A specific weight has been attributed to each company included in the EY index based on its market capitalization and revenues (each of these two parameters weighing for a half). The relative weights have been revised at every company inclusion after its initial public offering (IPO). Finally, the evolution of the EY index has been compared to these of the S&P 500 and STOXX Europe 600 indexes using 1 January 2008 as a starting date (rebased to 100). EY luxury and cosmetics index evolution compared to major indices (base 100 as of 1 January 2008) 250 As of 31 1 March CAGR 2015 08-15 200 187 9% 150 143 5% 111 1% 100 (Base 100 as of 1 March 2014) 120 118 115 116 50 111 110 0 105 100 EY INDEX STOXX S&P 95 90 85 Source: Capital IQ EY INDEX STOXX S&P Note: 1) Compound annual growth rate The luxury and cosmetics financial factbook 2015
 Seeking sustainable growth - The luxury and cosmetics financial factbook Page 6 Page 8