
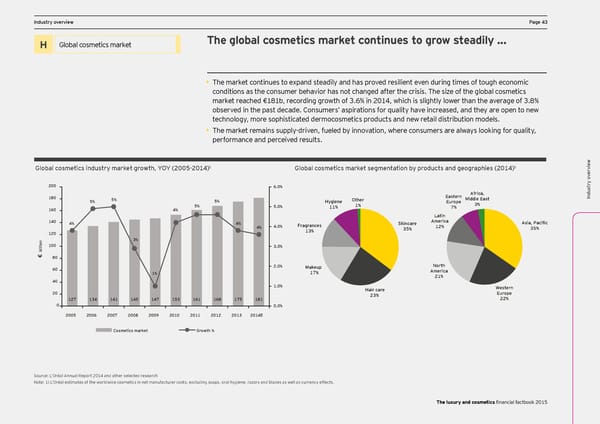
DCF and vIndustry oaluation pverview arameters PPage 43age 43 Ex ec The global cosmetics market continues to grow steadily … utiv Global luxury goods Title for section H Global cosmetics market e summary H X Welcome to the third edition of EY’s annual • TShae mles oaf irknedt cuostnrty pinulaeys tero es axrpe eanxd spetcetaedd tily ao gnrd how aas pt a hroveead rlthy resiliateen, lt eed bven dy duoruinbg tle-idmigeis ot anf tnouuagl gh erocwotnh romatice f or Financial Factbook for the luxury and cosmetics cLo’Oncdcititioanns ae as tnd Nhe catounrsa fumroem Fr beYh1a1vA tior ho FaYs n14oEt c. hanged after the crisis. The size of the global cosmetics DCF and v p market reached €181b, recording growth of 3.6% in 2014, which is slightly lower than the average of 3.8% ar X Increased demand through innovative products will cater to underserved emerging markets. sector. The Factbook combines financial observed in the past decade. Consumers’ aspirations for quality have increased, and they are open to new ame data, insight from EY’s global team of sector X aluation Introduction of eco-friendly, sustainable and naturally derived beauty products and cosmetics will stimulate t technology, more sophisticated dermocosmetics products and new retail distribution models. er specialists and opinions of external experts. s demand in established geographies. • The market remains supply-driven, fueled by innovation, where consumers are always looking for quality, performance and perceived results. Titles for charts Indusw 1 1 Global cosmetics industry market growth, YOY (2005-2014) Global cosmetics market segmentation by products and geographies (2014) try oervie v v 200 6.0% ervietry o Eastern Africa, w Indus 180 5% 5% 5% Hygiene Other Europe Middle East 5% 5.0% 11% 1% 7% 3% 160 4% Latin 140 4% 4% Fragrances Skincare America Asia, Pacific 4% 4.0% 12% 35% 120 13% 35% and disMe n 3% thodology o claimer i 100 l 3.0% l i b € 80 2.0% Makeup North 60 Titles for charts 17% America 1% 21% 40 1.0% 20 Hair care Western and specific analyS Europe 127 134 141 145 147 153 161 168 175 181 23% 22% ample s 0 0.0% 2005 2006 2007 2008 2009 2010 2011 2012 2013 2014E election s Cosmetics market Growth % e s Source: Data based on consensus of several brokers’ reports for each C Glo company. on t s act uss SNooutercse:M: La’rOkreét cal Aapnitnauliazl Ratieopn iors bt 2a0s1e4 ad onn a od otnhee-r smeolnetch ated rveerasgee aarcs oh f December 2012. ary NTohte 2e: 101) L2 g’Orroéawl eth cstiomrraetseps oonf tds the wo tohre sldwalieds ge crooswmteh rticas ite bn neetwt meean FnuYfa1c1tA aurenr cd FosYt1s, e2Ax/cElu. ding soaps, oral hygiene, razors and blades as well as currency effects. The luxury and cosmetics financial factbook 2015
 Seeking sustainable growth - The luxury and cosmetics financial factbook Page 44 Page 46