
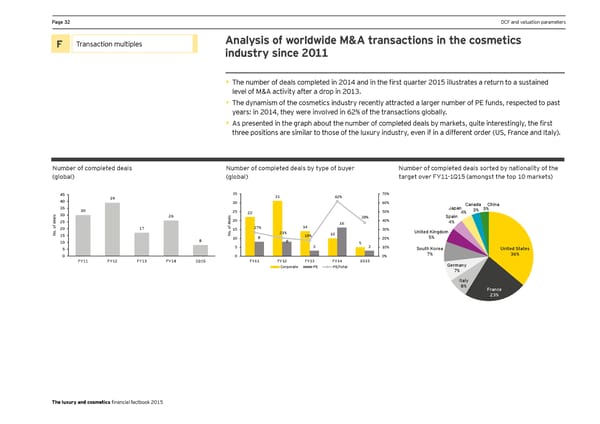
Page 32 DCF and valuation parameters F Transaction multiples Analysis of worldwide M&A transactions in the cosmetics industry since 2011 • The number of deals completed in 2014 and in the first quarter 2015 illustrates a return to a sustained level of M&A activity after a drop in 2013. • The dynamism of the cosmetics industry recently attracted a larger number of PE funds, respected to past years: in 2014, they were involved in 62% of the transactions globally. • As presented in the graph about the number of completed deals by markets, quite interestingly, the first three positions are similar to those of the luxury industry, even if in a different order (US, France and Italy). Number of completed deals Number of completed deals by type of buyer Number of completed deals sorted by nationality of the (global) (global) target over FY11-1Q15 (amongst the top 10 markets) 45 35 31 62% 70% 40 39 30 60% Canada China 35 30 25 50% Japan 3% 3% s 30 22 4% l 26 s Spain a l 38% e a20 40% d 25 e 4% d 16 f o f 27% 14 17 o . 20 15 30% o . N o 21% 10 United Kingdom 15 N 8 18% 5% 8 10 8 20% 10 5 5 5 3 3 10% South Korea United States 0 0 0% 7% 36% FY11 FY12 FY13 FY14 1Q15 FY11 FY12 FY13 FY14 1Q15 Germany Corporate PE PE/total 7% Italy 8% France 23% The luxury and cosmetics financial factbook 2015
 Seeking sustainable growth - The luxury and cosmetics financial factbook Page 33 Page 35