
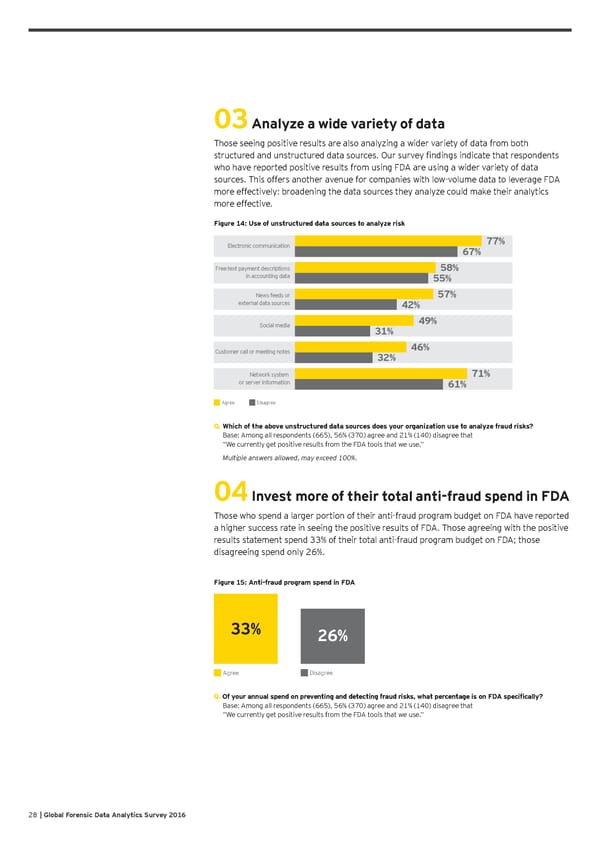
03 Analyze a wide variety of data Those seeing positive results are also analyzing a wider variety of data from both structured and unstructured data sources. Our survey findings indicate that respondents who have reported positive results from using FDA are using a wider variety of data sources. This offers another avenue for companies with low-volume data to leverage FDA more effectively: broadening the data sources they analyze could make their analytics more effective. Figure 14: Use of unstructured data sources to analyze risk Electronic communication 77% 67% Free text payment descriptions 58% in accounting data 55% News feeds or 57% external data sources 42% Social media 49% 31% Customer call or meeting notes 46% 32% Network system 71% or server information 61% Agree Disagree ▀ �▀ Q. Which of the above unstructured data sources does your organization use to analyze fraud risks? Base: Among all respondents (665), 56% (370) agree and 21% (140) disagree that “We currently get positive results from the FDA tools that we use.” Multiple answers allowed, may exceed 100%. 04 Invest more of their total anti-fraud spend in FDA Those who spend a larger portion of their anti-fraud program budget on FDA have reported a higher success rate in seeing the positive results of FDA. Those agreeing with the positive results statement spend 33% of their total anti-fraud program budget on FDA; those disagreeing spend only 26%. Figure 15: Anti-fraud program spend in FDA 33% 26% Agree Disagree ▀ ▀ Q. Of your annual spend on preventing and detecting fraud risks, what percentage is on FDA specifically? Base: Among all respondents (665), 56% (370) agree and 21% (140) disagree that “We currently get positive results from the FDA tools that we use.” 28 | Global Forensic Data Analytics Survey 2016
 Shifting into High Gear: Mitigating Risks and Demonstrating Returns Page 27 Page 29