
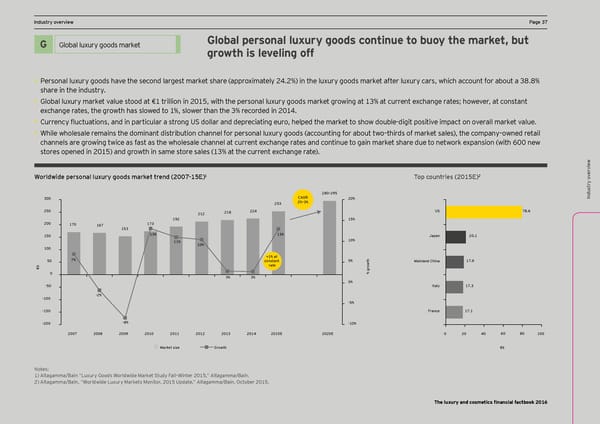
DCF and vIndustry oaluation pverview arameters PPage 37age 37 Ex ec Global personal luxury goods continue to buoy the market, but utiv Global luxury goods Title for section G Global luxury goods market e summary H growth is leveling off • Personal luxury goods have the second largest market share (approximately 24.2%) in the luxury goods market after luxury cars, which account for about a 38.8% X Welcome to the third edition of EY’s annual Sales of industry players are expected to grow at a healthy rate, led by double-digit annual growth rate for share in the industry. L’Occitane and Natura from FY11A to FY14E. DCF and v Financial Factbook for the luxury and cosmetics p • Global luxury market value stood at €1 trillion in 2015, with the personal luxury goods market growing at 13% at current exchange rates; however, at constant ar X Increased demand through innovative products will cater to underserved emerging markets. sector. Lhe >actbooc combines financial ame exchange rates, the growth has slowed to 1%, slower than the 3% recorded in 2014. data, insight from EY’s global team of sector X aluation Introduction of eco-friendly, sustainable and naturally derived beauty products and cosmetics will stimulate t er • Currency Ömctmations, and in particmlar a strong MK dollar and depreciating emro, helped the market to show double-digit positive impact on overall market value. s specialists and opinions of external experts. demand in established geographies. • While wholesale remains the dominant distribution channel for personal luxury goods (accounting for about two–thirds of market sales), the company–owned retail channels are growing twice as fast as the wholesale channel at current exchange rates and continue to gain market share due to network expansion (with 600 new Titles for charts stores opened in 2015) and growth in same store sales (13% at the current exchange rate). Indusw try oervie ) 2 v Ogjldoide pejsgnal lmpmjy _ggds eajcel ljend *((/Ç)-=! Lgp cgmnljies *()-=! v ervietry o 280–295 CAGR w Indus 300 253 2%–3% 20% 250 212 218 224 US 78.6 192 15% 200 170 167 173 150 153 13% 13% Japan 20.1 and disMe 11% 10% thodology 100 10% claimer +1% at 7% 50 constant 5% Mainland China 17.9 b rate owth € gr Titles for charts 0 % 3% 3% 0% -50 Italy 17.3 -2% and specific analyS -100 -5% ample s -150 France 17.1 election -200 -8% -10% s e 2007 2008 2009 2010 2011 2012 2013 2014 2015E 2020E 0 20 40 60 80 100 s Market size Growth €b Source: Data based on consensus of several brokers’ reports for each C Glo company. on Notes: t s act uss N)! 9otelst:aMgaarkmet cmaap':itaaliin ÉzatiDomn ixs bmrq ?ased ooon a ods Onoer-mldoonitdh ae Eveararcege at Kts omf Ddq >eceamllbÇOer 2in0te12r *. ()-,Ê Altagamma/Bain. ary The 2012 growth corresponds to the sales growth rate between FY11A and FY12A/E. *! 9ltagamma':ain, ÉOorldoide Dmxmrq Earcets Eonitor, *()- Mpdate,Ê Altagamma/Bain, October 2015. The luxury and cosmetics financial factbook 2016
 Luxury and Cosmetic Financial Factbook Page 38 Page 40