
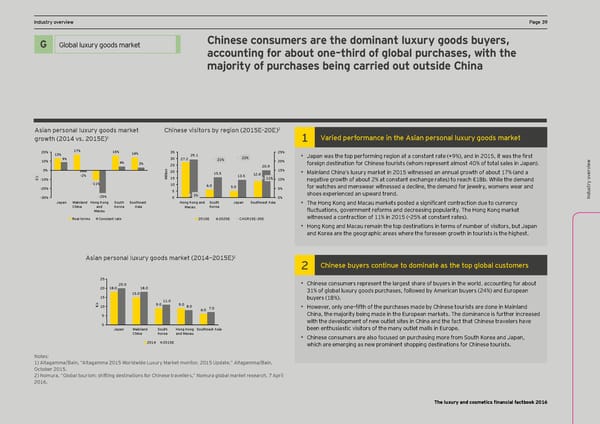
DCF and vIndustry oaluation pverview arameters HPa_e +1age +1 Ex ec Chinese consumers are the dominant luxury goods buyers, utiv Global luxury goods Title for section G Global luxury goods market e summary H accounting for about one–third of global purchases, with the majority of purchases being carried out outside China X Welcome to the third edition of EY’s annual Sales of industry players are expected to grow at a healthy rate, led by double-digit annual growth rate for Financial Factbook for the luxury and cosmetics L’Occitane and Natura from FY11A to FY14E. DCF and v p X ar Increased demand through innovative products will cater to underserved emerging markets. sector. Lhe >actbooc combines financial ame data, insight from EY’s global team of sector X aluation Introduction of eco-friendly, sustainable and naturally derived beauty products and cosmetics will stimulate t er specialists and opinions of external experts. s demand in established geographies. 2 9sian pejsgnal lmpmjy _ggds eajcel ;`inese nisilgjs Zy je_ign *()-=Ç*(=! ) Najied pej^gjeance in l`e 9sian pejsgnal lmpmjy _ggds eajcel _jgol` *(), ns& *()-=! ) 17% 16% Titles for charts 25% 20% 13% 14% 35 29.1 • Japan was the top performing region at a constant rate (+9%), and in 2015, it oas the first 10% 9% 30 27.2 21% 22% 20% Indusw 4% 3% 25 foreign destination for Chinese tourists (whom represent almost 40% of total sales in Japan). n 20.9 0% o 20 15% try o i 15.5 • Mainland China’s luxury market in 2015 witnessed an annual growth of about 17% (and a ervie l 12.6 l b -2% i 15 13.5 v € -10% M 11% 10% negative growth of about 2% at constant exchange rates) to reach €18b. While the demand v -20% -11% 10 6.0 5.0 5% for watches and menswear witnessed a decline, the demand for jewelry, womens wear and ervietry o 5 -30% -25% 0 1% 0% shoes experienced an upward trend. w Indus Japan Mainland Hong Kong South Southeast Hong Kong and South Japan Southeast Asia • The @ong Cong and Eacam marcets posted a significant contraction due to currency China and Korea Asia Macau Korea Ömctmations, gonernment reforms and decreasing popmlaritq. Lhe @ong Cong marcet Macau Real terms Constant rate 2015E 2020E CAGR15E–20E witnessed a contraction of 11% in 2015 (–25% at constant rates). • Hong Kong and Macau remain the top destinations in terms of number of visitors, but Japan and Korea are the geographic areas where the foreseen growth in tourists is the highest. and disMe thodology claimer ) 9sian pejsgnal lmpmjy _ggds eajcel *(),È*()-=! 2 ;`inese Zmyejs cgnlinme lg dgeinale as l`e lgp _lgZal cmslgeejs Titles for charts 25 • Chinese consumers represent the largest share of buyers in the world, accounting for about 20.0 20 18.0 15.018.0 31% of global luxury goods purchases, followed by American buyers (24%) and European and specific analyS b 15 11.0 buyers (18%). ample s € 10 9.0 9.0 8.0 • However, onlq oneÇfifth of the pmrchases made bq ;hinese tomrists are done in Eainland 6.0 7.0 5 China, the majority being made in the European markets. The dominance is further increased election 0 with the development of new outlet sites in China and the fact that Chinese travelers have Japan Mainland South Hong Kong Southeast Asia been enthusiastic visitors of the many outlet malls in Europe. s e China Korea and Macau s 2014 2015E • Chinese consumers are also focused on purchasing more from South Korea and Japan, which are emerging as new prominent shopping destinations for Chinese tourists. Notes: Source: Data based on consensus of several brokers’ reports for each )! 9ltagamma':ain, É9ltagamma *()- Oorldoide Dmxmrq Earcet monitor, *()- Mpdate,Ê Altagamma/Bain, C Glo company. on October 2015. t s act uss Notes:Market capitalization is based on a one-month average as of December 2012. ary 2) Nomura, “Global tourism: shifting destinations for Chinese travellers,” Nomura global market research, 7 April The 2012 growth corresponds to the sales growth rate between FY11A and FY12A/E. 2016. The luxury and cosmetics financial factbook 2016
 Luxury and Cosmetic Financial Factbook Page 40 Page 42