
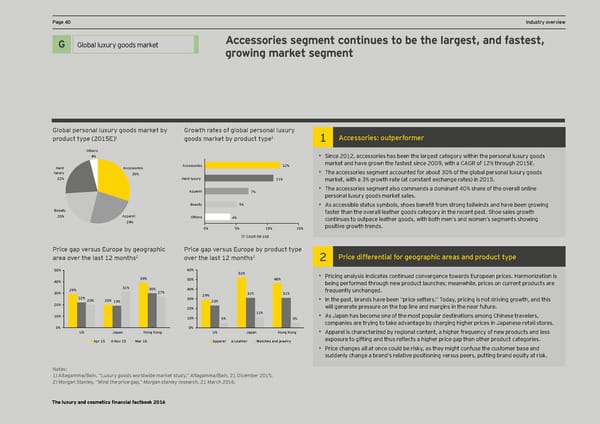
HPa_e ,(age ,( DCF and valuation pIndustry oaramevervieterws Accessories segment continues to be the largest, and fastest, Global luxury goods Title for section G Global luxury goods market H growing market segment X Welcome to the third edition of EY’s annual Sales of industry players are expected to grow at a healthy rate, led by double-digit annual growth rate for Financial Factbook for the luxury and cosmetics L’Occitane and Natura from FY11A to FY14E. X sector. Lhe >actbooc combines financial Increased demand through innovative products will cater to underserved emerging markets. data, insight from EY’s global team of sector X Introduction of eco-friendly, sustainable and naturally derived beauty products and cosmetics will stimulate specialists and opinions of external experts. demand in established geographies. ?lgZal pejsgnal lmpmjy _ggds eajcel Zy ?jgol` jales g^ _lgZal pejsgnal lmpmjy ) ) 9ccessgjies2 gmlpej^gjeej pjgdmcl lype *()-=! _ggds eajcel Zy pjgdmcl lype ) Others Titles for charts 4% • Since 2012, accessories has been the largest category within the personal luxury goods Accessories 12% market and have grown the fastest since 2009, with a CAGR of 12% through 2015E. Hard Accessories luxury 30% • The accessories segment accounted for about 30% of the global personal luxury goods 22% Hard luxury 11% market, with a 3% growth rate (at constant exchange rates) in 2015. Apparel 7% • The accessories segment also commands a dominant 40% share of the overall online personal luxury goods market sales. Beauty 5% • As accessible statms sqmbols, shoes benefit from strong tailoinds and hane been grooing Beauty faster than the overall leather goods category in the recent past. Shoe sales growth 20% Apparel Others 4% continues to outpace leather goods, with both men’s and women’s segments showing 24% positive growth trends. 0% 5% 10% 15% CAGR 09-15E Hjice _ap nejsms =mjgpe Zy _eg_jap`ic Hjice _ap nejsms =mjgpe Zy pjgdmcl lype ajea gnej l`e lasl )* egnl`s2 gnej l`e lasl )* egnl`s2 2 Hjice di^^ejenlial ^gj _eg_jap`ic ajeas and pjgdmcl lype 50% Titles for charts 60% 52% 39% 50% 46% • Pricing analysis indicates continued convergence towards European prices. Harmonization is 40% being performed through new product launches; meanwhile, prices on current products are 29% 31% 30% 40% freimentlq mnchanged. 30% 27% 29% 31% 31% 22% 20% 20% 19% 30% 23% • In the past, brands have been “price setters.” Today, pricing is not driving growth, and this 20% will generate pressure on the top line and margins in the near future. 20% 10% 11% • As Japan has become one of the most popular destinations among Chinese travelers, 10% 5% 5% companies are trying to take advantage by charging higher prices in Japanese retail stores. 0% 0% US Japan Hong Kong US Japan Hong Kong • Apparel is characterired bq regional content, a higher freimencq of neo prodmcts and less Apr 15 Nov 15 Mar 16 Apparel Leather Watches and jewelry exposmre to gifting and thms reÖects a higher price gap than other prodmct categories. • Price changes all at once could be risky, as they might confuse the customer base and Source: Data based on consensus of several brokers’ reports for each suddenly change a brand’s relative positioning nersms peers, pmtting brand eimitq at risc. company. Notes: N)o! 9telst:aMgaarkmet cmaap':itaaliinza, ÉtioDn imxs bmraq gsed ooon a ods onoer-mldoonitdh ae mvearargcee at ss otmf Ddqe,cÊ emAlbtaer 2ga0m1m2. a/Bain, 21 Dicember 2015. The 2012 growth corresponds to the sales growth rate between FY11A and FY12A/E. 2) Morgan Stanley, “Mind the price gap,” Morgan stanley research, 21 March 2016. The luxury and cosmetics financial factbook 2016
 Luxury and Cosmetic Financial Factbook Page 41 Page 43