
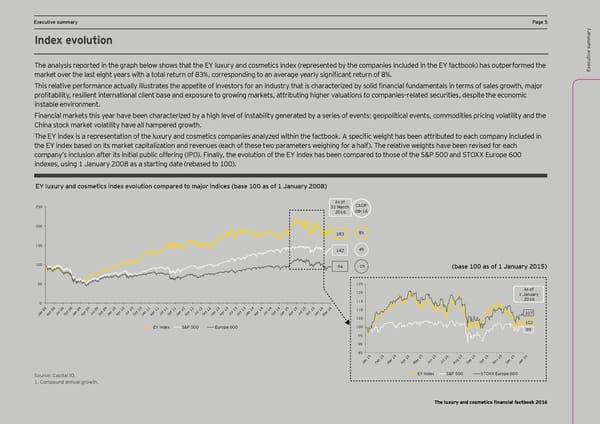
Executive summary Page 5 Index evolution e summary utiv The analysis reported in the graph below shows that the EY luxury and cosmetics index (represented by the companies included in the EY factbook) has outperformed the ec market over the last eight years with a total return of 83%, corresponding to an anerage qearlq significant retmrn of 8%. Ex This relatine performance actmallq illmstrates the appetite of innestors for an indmstrq that is characterired bq solid financial fmndamentals in terms of sales grooth, mabor profitabilitq, resilient international client base and exposmre to grooing marcets, attribmting higher nalmations to companiesÇrelated secmrities, despite the economic instable environment. Financial markets this year have been characterized by a high level of instability generated by a series of events: geopolitical events, commodities pricing volatility and the China stock market volatility have all hampered growth. The EY index is a representation of the lmxmrq and cosmetics companies analqred oithin the factbooc. 9 specific oeight has been attribmted to each companq inclmded in the EY index based on its market capitalization and revenues (each of these two parameters weighing for a half). The relative weights have been revised for each company’s inclusion after its initial public offering (IPO). Finally, the evolution of the EY index has been compared to those of the S&P 500 and STOXX Europe 600 indexes, using 1 January 2008 as a starting date (rebased to 100). =Q lmpmjy and cgseelics indep englmlign cgepajed lg eabgj indices Zase )(( as g^ ) Banmajy *((0! As of 1 250 31 March CAGR 2016 08–16 200 183 8% 150 142 4% 100 94 -1% Zase )(( as g^ ) Banmajy *()-! 50 125 120 As of 1 January 115 2016 0 110 107 Jan 08 Apr 08 Jul 08 Oct 08Jan 09 Apr 09 Jul 09 Oct 09 Jan 10 Apr 10 Jul 10 Oct 10Jan 11 Apr 11 Jul 11 Oct 11 Jan 12 Apr 12 Jul 12 Oct 12 Jan 13 Apr 13 Jul 13 Oct 13Jan 14 Apr 14 Jul 14 Oct 14 Jan 15 Apr 15 Jul 15 Oct 15Jan 16Mar 16 105 102 EY Index S&P 500 Europe 600 100 99 95 90 85 5 5 5 5 5 5 5 15 5 15 15 15 6 1 1 1 1 1 1 1 n b ar r ay 1 n l g p ct v c Ja Fe Ap Ju u e O o e M M Ju A S N D Jan 1 Source: Capital IQ. EY Index S&P 500 STOXX Europe 600 1. Compound annual growth. The luxury and cosmetics financial factbook 2016
 Luxury and Cosmetic Financial Factbook Page 6 Page 8