
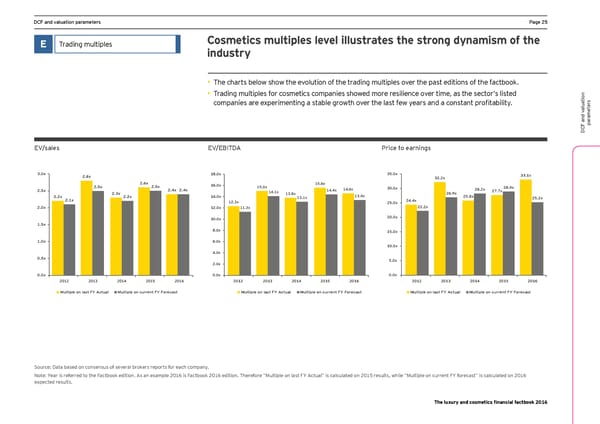
DCF and valuation parameters Page 25 Trading multiples Cosmetics multiples level illustrates the strong dynamism of the E industry • The charts below show the evolution of the trading multiples over the past editions of the factbook. • Trading multiples for cosmetics companies showed more resilience over time, as the sector’s listed companies are experimenting a stable grooth oner the last feo qears and a constant profitabilitq. s er aluationt ame ar p DCF and v EV/sales EV/EBITDA Price to earnings 3.0x 2.8x 18.0x 35.0x 33.1x 32.2x 2.5x 2.6x 2.5x 16.0x 15.6x 2.4x 2.4x 15.0x 14.4x 14.6x 30.0x 28.2x 28.9x 2.5x 2.3x 14.1x 13.8x 26.9x 27.7x 2.2x 2.2x 14.0x 13.1x 13.4x 25.8x 25.2x 2.1x 12.3x 25.0x 24.4x 2.0x 12.0x 11.3x 22.2x 10.0x 20.0x 1.5x 8.0x 15.0x 1.0x 6.0x 10.0x 4.0x 0.5x 5.0x 2.0x 0.0x 0.0x 0.0x 2012 2013 2014 2015 2016 2012 2013 2014 2015 2016 2012 2013 2014 2015 2016 Multiple on last FY Actual Multiple on current FY Forecast Multiple on last FY Actual Multiple on current FY Forecast Multiple on last FY Actual Multiple on current FY Forecast Source: Data based on consensus of several brokers reports for each company. Note: Year is referred to the Factbook edition. As an example 2016 is Factbook 2016 edition. Therefore “Multiple on last FY Actual” is calculated on 2015 results, while “Multiple on current FY forecast” is calculated on 2016 expected results. The luxury and cosmetics financial factbook 2016
 Luxury and Cosmetic Financial Factbook Page 26 Page 28