
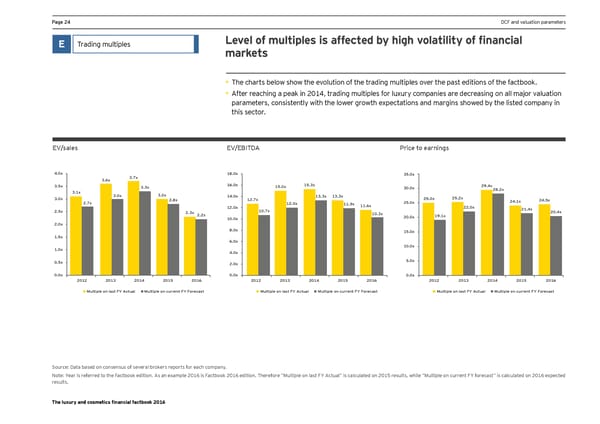
Page 24 DCF and valuation parameters E Trading multiples Level of multiples is affected by high volatility of financial markets • The charts below show the evolution of the trading multiples over the past editions of the factbook. • After reaching a peak in 2014, trading multiples for luxury companies are decreasing on all major valuation parameters, consistently with the lower growth expectations and margins showed by the listed company in this sector. EV/sales EV/EBITDA Price to earnings 4.0x 18.0x 35.0x 3.6x 3.7x 3.5x 3.3x 16.0x 15.0x 15.3x 30.0x 29.4x 3.1x 28.2x 3.0x 3.0x 3.0x 14.0x 13.3x 13.3x 25.0x 25.2x 2.7x 2.8x 12.7x 25.0x 24.1x 24.5x 12.0x 11.9x 11.6x 12.0x 10.7x 22.0x 21.4x 2.5x 2.3x 2.2x 10.3x 20.4x 10.0x 20.0x 19.1x 2.0x 8.0x 15.0x 1.5x 6.0x 1.0x 10.0x 4.0x 0.5x 2.0x 5.0x 0.0x 0.0x 0.0x 2012 2013 2014 2015 2016 2012 2013 2014 2015 2016 2012 2013 2014 2015 2016 Multiple on last FY Actual Multiple on current FY Forecast Multiple on last FY Actual Multiple on current FY Forecast Multiple on last FY Actual Multiple on current FY Forecast Source: Data based on consensus of several brokers reports for each company. Note: Year is referred to the Factbook edition. As an example 2016 is Factbook 2016 edition. Therefore “Multiple on last FY Actual” is calculated on 2015 results, while “Multiple on current FY forecast” is calculated on 2016 expected results. The luxury and cosmetics financial factbook 2016
 Luxury and Cosmetic Financial Factbook Page 25 Page 27