
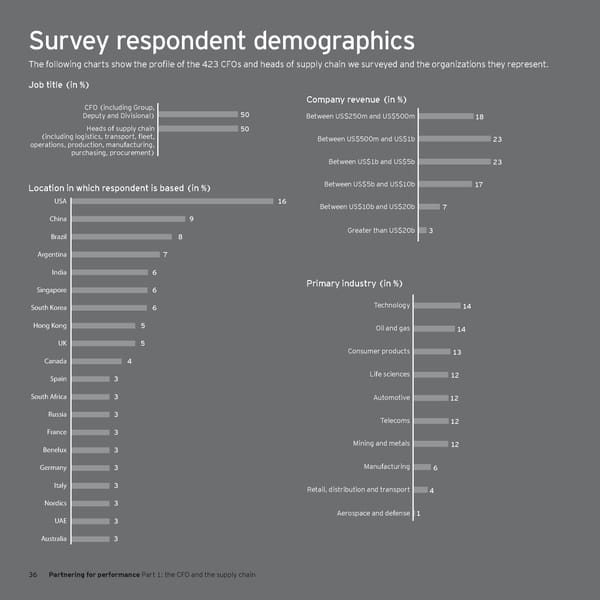
Survey respondent demographics The following charts show the profile of the 423 CFOs and heads of supply chain we surveyed and the organizations they represent. Job title (in %) Between US$100m and US$250m 8 Company revenue (in %) CFO (including Group, Deputy and Divisional) 50 Between US$250m and US$500m 18 Heads of supply chain 50 (including logistics, transport, fleet, Between US$500m and US$1b 23 operations, production, manufacturing, purchasing, procurement) Between US$1b and US$5b 23 Location in which respondent is based (in %) Between US$5b and US$10b 17 USA 16 Between US$10b and US$20b 7 China 9 Greater than US$20b 3 Brazil 8 Argentina 7 India 6 Singapore Primary industry (in %) 6 South Korea 6 Technology 14 Hong Kong 5 Oil and gas 14 UK 5 Consumer products 13 Canada 4 Spain 3 Life sciences 12 South Africa 3 Automotive 12 Russia 3 Telecoms 12 France 3 Mining and metals 12 Benelux 3 Germany 3 Manufacturing 6 Italy 3 Retail, distribution and transport 4 Nordics 3 Aerospace and defense 1 UAE 3 Australia 3 36 Partnering for performance Part 1: the CFO and the supply chain
 Partnering for Performance Part 1 Page 37 Page 39