
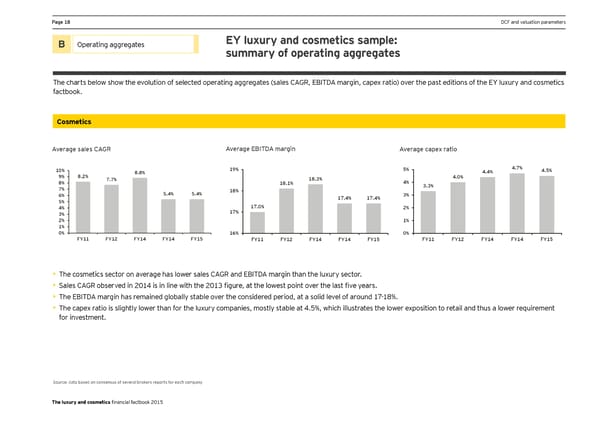
Page 18 DCF and valuation parameters B Operating aggregates EY luxury and cosmetics sample: summary of operating aggregates The charts below show the evolution of selected operating aggregates (sales CAGR, EBITDA margin, capex ratio) over the past editions of the EY luxury and cosmetics factbook. Cosmetics Average sales CAGR Average EBITDA margin Average capex ratio 10% 19% 5% 4.4% 4.7% 4.5% 9% 8.2% 8.8% 4.0% 8% 7.7% 18.1% 18.3% 4% 7% 3.3% 5.4% 5.4% 18% 3% 6% 17.4% 17.4% 5% 4% 17.0% 2% 3% 17% 2% 1% 1% 0% 16% 0% FY11 FY12 FY14 FY14 FY15 FY11 FY12 FY14 FY14 FY15 FY11 FY12 FY14 FY14 FY15 Sales Growth Ebitda Margin Capex ratio • The cosmetics sector on average has lower sales CAGR and EBITDA margin than the luxury sector. • Sales CAGR observed in 2014 is in line with the 2013 figure, at the lowest point over the last five years. • The EBITDA margin has remained globally stable over the considered period, at a solid level of around 17-18%. • The capex ratio is slightly lower than for the luxury companies, mostly stable at 4.5%, which illustrates the lower exposition to retail and thus a lower requirement for investment. Source: data based on consensus of several brokers reports for each company The luxury and cosmetics financial factbook 2015
 Seeking sustainable growth - The luxury and cosmetics financial factbook Page 19 Page 21