
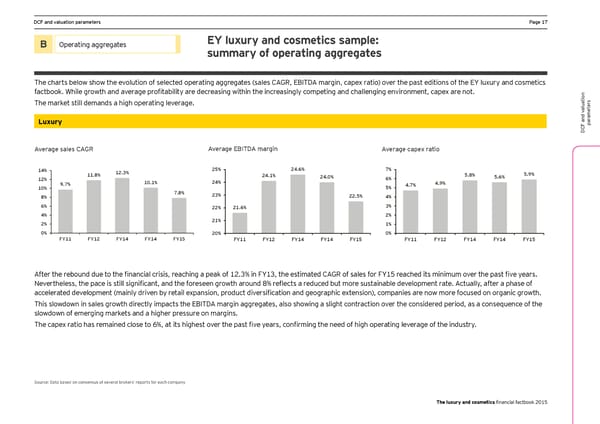
DCF and valuation parameters Page 17 B Operating aggregates EY luxury and cosmetics sample: summary of operating aggregates The charts below show the evolution of selected operating aggregates (sales CAGR, EBITDA margin, capex ratio) over the past editions of the EY luxury and cosmetics factbook. While growth and average profitability are decreasing within the increasingly competing and challenging environment, capex are not. The market still demands a high operating leverage. s er aluationt ame Luxury ar p DCF and v Average sales CAGR Average EBITDA margin Average capex ratio 14% 12.3% 25% 24.6% 7% 11.8% 24.1% 24.0% 6% 5.8% 5.6% 5.9% 12% 10.1% 24% 4.9% 10% 9.7% 5% 4.7% 8% 7.8% 23% 22.5% 4% 6% 22% 21.6% 3% 4% 2% 2% 21% 1% 0% 20% 0% FY11 FY12 FY14 FY14 FY15 FY11 FY12 FY14 FY14 FY15 FY11 FY12 FY14 FY14 FY15 Sales Growth Ebitda Margin Capex ratio After the rebound due to the financial crisis, reaching a peak of 12.3% in FY13, the estimated CAGR of sales for FY15 reached its minimum over the past five years. Nevertheless, the pace is still significant, and the foreseen growth around 8% reflects a reduced but more sustainable development rate. Actually, after a phase of accelerated development (mainly driven by retail expansion, product diversification and geographic extension), companies are now more focused on organic growth. This slowdown in sales growth directly impacts the EBITDA margin aggregates, also showing a slight contraction over the considered period, as a consequence of the slowdown of emerging markets and a higher pressure on margins. The capex ratio has remained close to 6%, at its highest over the past five years, confirming the need of high operating leverage of the industry. Source: Data based on consensus of several brokers’ reports for each company The luxury and cosmetics financial factbook 2015
 Seeking sustainable growth - The luxury and cosmetics financial factbook Page 18 Page 20