
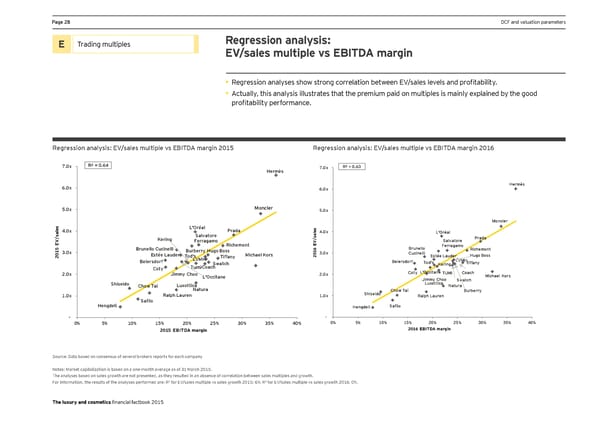
Page 28 DCF and valuation parameters E Trading multiples Regression analysis: EV/sales multiple vs EBITDA margin • Regression analyses show strong correlation between EV/sales levels and profitability. • Actually, this analysis illustrates that the premium paid on multiples is mainly explained by the good profitability performance. Regression analysis: EV/sales multiple vs EBITDA margin 2015 Regression analysis: EV/sales multiple vs EBITDA margin 2016 7.0x R² = 0.64 7.0x R² = 0.63 Hermès 6.0x Hermès 6.0x 5.0x Moncler 5.0x s Moncler e L'Oréal s l 4.0x Prada e 4.0x l L'Oréal sa Salvatore a / s Prada V Kering Ferragamo / Salvatore E V Richemont E Ferragamo Brunello 5 Brunello Cucinelli Burberry Hugo Boss 6 Richemont 1 3.0x 1 3.0x Cucinelli 0 Estée Lauder Michael Kors 0 Estée Lauder Hugo Boss 2 Tod's Tiffany 2 Beiersdorf LVMH Beiersdorf Tod's LVMH Swatch Kering Tiffany Coty TumiCoach 2.0x Jimmy Choo 2.0x Coty L'Occitane TUMI Coach Michael Kors L'Occitane Jimmy Choo Swatch Shiseido Chow Tai Luxottica Luxottica Natura Natura Chow Tai Burberry 1.0x Ralph Lauren 1.0x Shiseido Ralph Lauren Safilo Hengdeli Hengdeli Safilo - - 0% 5% 10% 15% 20% 25% 30% 35% 40% 0% 5% 10% 15% 20% 25% 30% 35% 40% 2015 EBITDA margin 2016 EBITDA margin Source: Data based on consensus of several brokers reports for each company Notes: Market capitalization is based on a one-month average as of 31 March 2015. The analyses based on sales growth are not presented, as they resulted in an absence of correlation between sales multiples and growth. 2 2 For information, the results of the analyses performed are: R for EV/sales multiple vs sales growth 2015: 6%; R for EV/sales multiple vs sales growth 2016: 0%. The luxury and cosmetics financial factbook 2015
 Seeking sustainable growth - The luxury and cosmetics financial factbook Page 29 Page 31