
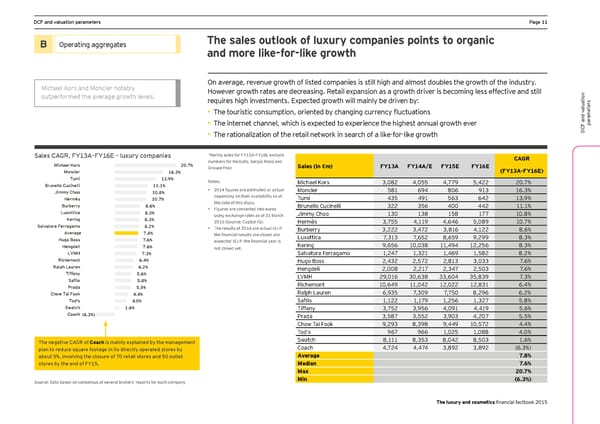
DCF and valuation parameters Page 11 B Operating aggregates The sales outlook of luxury companies points to organic and more like-for-like growth Michael Kors and Moncler notably On average, revenue growth of listed companies is still high and almost doubles the growth of the industry. However growth rates are decreasing. Retail expansion as a growth driver is becoming less effective and still outperformed the average growth levels. requires high investments. Expected growth will mainly be driven by: s er • The touristic consumption, oriented by changing currency fluctuations aluationt ame ar • The internet channel, which is expected to experience the highest annual growth ever p • The rationalization of the retail network in search of a like-for-like growth DCF and v Sales CAGR, FY13A–FY16E – luxury companies *Kering sales for FY13A-FY16E exclude CAGR Michael Kors 20.7% numbers for Redcats, Sergio Rossi and Sales (in €m) FY13A FY14A/E FY15E FY16E Moncler Groupe Fnac (FY13A-FY16E) 16.3% Tumi 13.9% Notes: Michael Kors 3,082 4,055 4,779 5,422 20.7% Brunello Cucinelli 11.1% Jimmy Choo 10.8% • 2014 figures are estimated or actual Moncler 581 694 806 913 16.3% Hermès 10.7% depending on their availability as of Tumi 435 491 563 642 13.9% Burberry 8.6% the date of this study. Brunello Cucinelli 322 356 400 442 11.1% Luxottica 8.3% • Figures are converted into euros Jimmy Choo 130 138 158 177 10.8% Kering 8.3% using exchange rates as of 31 March 2015 (Source: Capital IQ). Hermès 3,755 4,119 4,646 5,089 10.7% Salvatore Ferragamo 8.2% • The results of 2014 are actual (A) if Burberry 3,222 3,472 3,816 4,122 8.6% Average 7.8% the financial results are closed and Luxottica 7,313 7,652 8,659 9,299 8.3% Hugo Boss 7.6% expected (E) if the financial year is Hengdeli 7.6% not closed yet. Kering 9,656 10,038 11,494 12,256 8.3% LVMH 7.3% Salvatore Ferragamo 1,247 1,321 1,469 1,582 8.2% Richemont 6.4% Hugo Boss 2,432 2,572 2,813 3,033 7.6% Ralph Lauren 6.2% Hengdeli 2,008 2,217 2,347 2,503 7.6% Tiffany 5.6% LVMH 29,016 30,638 33,604 35,839 7.3% Safilo 5.8% Richemont 10,649 11,042 12,022 12,831 6.4% Prada 5.5% Chow Tai Fook 4.4% Ralph Lauren 6,935 7,309 7,750 8,296 6.2% Tod's 4.0% Safilo 1,122 1,179 1,256 1,327 5.8% Swatch 1.6% Tiffany 3,752 3,956 4,091 4,419 5.6% Coach (6.3%) Prada 3,587 3,552 3,903 4,207 5.5% Chow Tai Fook 9,293 8,398 9,449 10,572 4.4% Tod’s 967 966 1,025 1,088 4.0% The negative CAGR of Coach is mainly explained by the management Swatch 8,111 8,353 8,042 8,503 1.6% plan to reduce square footage in its directly operated stores by Coach 4,724 4,474 3,892 3,892 (6.3%) about 5%, involving the closure of 70 retail stores and 50 outlet Average 7.8% stores by the end of FY15. Median 7.6% Max 20.7% Source: Data based on consensus of several brokers’ reports for each company Min (6.3%) The luxury and cosmetics financial factbook 2015
 Seeking sustainable growth - The luxury and cosmetics financial factbook Page 12 Page 14