
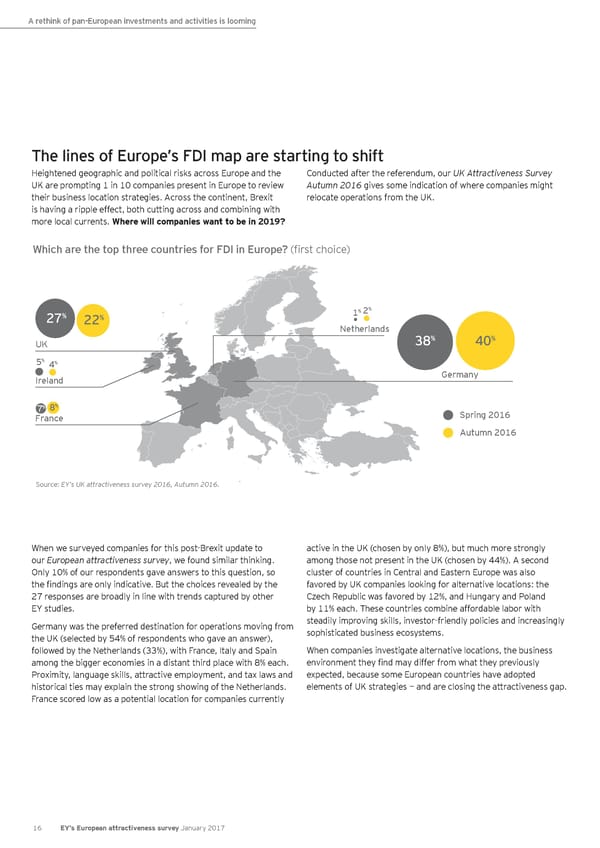
A rethink of pan-European investments and activities is looming The lines of Europe’s FDI map are starting to shift Heightened geographic and political risks across Europe and the Conducted after the referendum, our UK Attractiveness Survey UK are prompting 1 in 10 companies present in Europe to review Autumn 2016 gives some indication of where companies might their business location strategies. Across the continent, Brexit relocate operations from the UK. is having a ripple effect, both cutting across and combining with more local currents. Where will companies want to be in 2019? Which are the top three countries for FDI in Europe? (first choice) % % 27% 22% 1 2 Netherlands UK 38% 40% % % 5 4 Ireland Germany % % 7 8 Spring 2016 France Autumn 2016 Source: EY’s UK attractiveness survey 2016, Autumn 2016. When we surveyed companies for this post-Brexit update to active in the UK (chosen by only 8%), but much more strongly our European attractiveness survey, we found similar thinking. among those not present in the UK (chosen by 44%). A second Only 10% of our respondents gave answers to this question, so cluster of countries in Central and Eastern Europe was also the findings are only indicative. But the choices revealed by the favored by UK companies looking for alternative locations: the 27 responses are broadly in line with trends captured by other Czech Republic was favored by 12%, and Hungary and Poland EY studies. by 11% each. These countries combine affordable labor with Germany was the preferred destination for operations moving from steadily improving skills, investor-friendly policies and increasingly the UK (selected by 54% of respondents who gave an answer), sophisticated business ecosystems. followed by the Netherlands (33%), with France, Italy and Spain When companies investigate alternative locations, the business among the bigger economies in a distant third place with 8% each. environment they find may differ from what they previously Proximity, language skills, attractive employment, and tax laws and expected, because some European countries have adopted historical ties may explain the strong showing of the Netherlands. elements of UK strategies — and are closing the attractiveness gap. France scored low as a potential location for companies currently 16 EY’s European attractiveness survey January 2017
 European attractiveness survey January 2017 Page 20 Page 22