
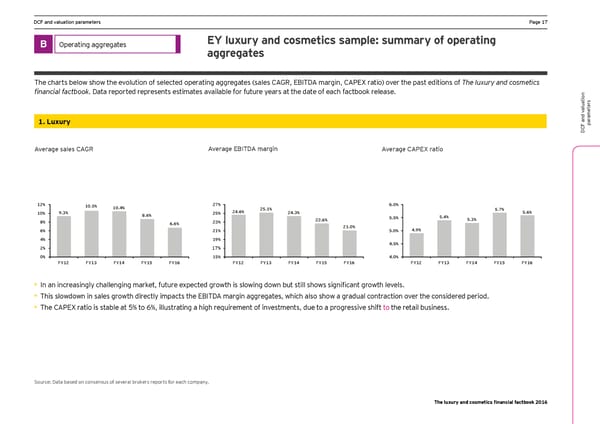
DCF and valuation parameters Ha_e )/ B Operating aggregates EY luxury and cosmetics sample: summary of operating aggregates The charts below show the evolution of selected operating aggregates (sales CAGR, EBITDA margin, CAPEX ratio) over the past editions of The luxury and cosmetics financial factbook. Data reported represents estimates available for future years at the date of each factbook release. s er aluationt ame 1. Luxury ar p DCF and v Average sales CAGR Average EBITDA margin Average CAPEX ratio 12% 10.5% 10.4% 27% 6.0% 9.3% 24.6% 25.1% 24.3% 5.7% 5.6% 10% 8.6% 25% 5.4% 22.6% 5.5% 5.3% 8% 6.6% 23% 6% 21% 21.0% 5.0% 4.9% 4% 19% 2% 17% 4.5% 0% 15% 4.0% FY12 FY13 FY14 FY15 FY16 FY12 FY13 FY14 FY15 FY16 FY12 FY13 FY14 FY15 FY16 • An an increasinglq challenging marcet, fmtmre expected grooth is slooing doon bmt still shoos significant grooth lenels. • This slowdown in sales growth directly impacts the EBITDA margin aggregates, which also show a gradual contraction over the considered period. • Lhe ;9HEP ratio is stable at - to . , illmstrating a high reimirement of innestments, dme to a progressine shift to the retail business. Source: Data based on consensus of several brokers reports for each company. The luxury and cosmetics financial factbook 2016
 Luxury and Cosmetic Financial Factbook Page 18 Page 20