
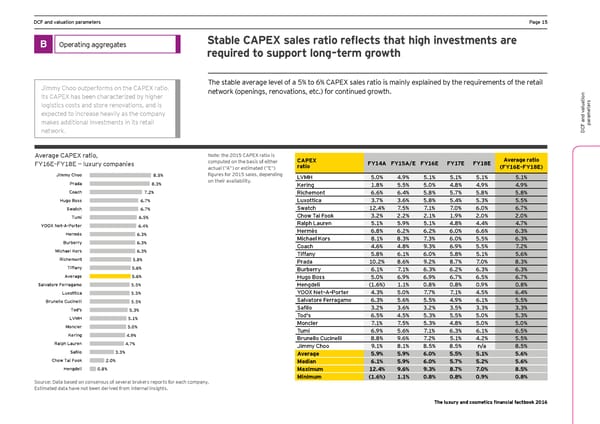
DCF and valuation parameters Ha_e )- B Operating aggregates Stable CAPEX sales ratio reflects that high investments are required to support long–term growth Jimmy Choo outperforms on the CAPEX ratio. The stable anerage lenel of a - to . ;9HEP sales ratio is mainlq explained bq the reimirements of the retail network (openings, renovations, etc.) for continued growth. Its CAPEX has been characterized by higher s logistics costs and store renovations, and is er aluationt expected to increase heavily as the company ame makes additional investments in its retail ar p network. DCF and v Average CAPEX ratio, Note: the 2015 CAPEX ratio is CAPEX Average ratio >Q).=Ç>Q)0= È lmpmjy cgepanies computed on the basis of either ratio FY14A FY15A/E FY16E FY17E FY18E (FY16E–FY18E) actual (“A“) or estimated (“E“) Jimmy Choo 8.5% figmres for *()- sales, depending LVMH -&( ,&1 -&) -&) -&) -&) Prada 8.3% on their availability. Kering )&0 -&- -&( ,&0 ,&1 ,&1 Coach 7.2% Richemont .&. .&, -&0 -&/ -&0 -&0 Hugo Boss 6.7% Luxottica +&/ +&. -&0 -&, -&+ -&- Swatch 6.7% Swatch )*&, /&- /&) /&( .&( .&/ Tumi 6.5% ;`go Lai >ggc +&* *&* *&) )&1 *&( *&( YOOX Net-A-Porter 6.4% Ralph Lauren -&) -&1 -&) ,&0 ,&, ,&/ Hermès 6.3% Hermès .&0 .&* .&* .&( .&. .&+ Burberry 6.3% Michael Kors 0&) 0&+ /&+ .&( -&- .&+ Michael Kors Coach ,&. ,&0 1&+ .&1 -&- /&* 6.3% Li^^any -&0 .&) .&( -&0 -&) -&. Richemont 5.8% Prada )(&* 0&. 1&* 0&/ /&( 0&+ Tiffany 5.6% :mjZejjy .&) /&) .&+ .&* .&+ .&+ Average 5.6% Hugo Boss -&( .&1 .&1 .&/ .&- .&/ Salvatore Ferragamo 5.5% Hengdeli )&. ! )&) (&0 (&0 (&1 (&0 Luxottica 5.5% YOOX Net–A–Porter ,&+ -&( /&/ /&) ,&- .&, L'Oréal21.9% Brunello Cucinelli 5.5% Salvatore Ferragamo .&+ -&. -&- ,&1 .&) -&- Tod's 5.3% Kafilg +&* +&. +&* +&- +&+ +&+ Estée Lauder20.2% Tod's .&- ,&- -&+ -&- -&( -&+ Natura19.4% LVMH 5.1% Moncler /&) /&- -&+ ,&0 -&( -&( Moncler 5.0% Tumi .&1 -&. /&) .&+ .&) .&- Coty19.0% Kering 4.9% Average18.0% Brunello Cucinelli 0&0 1&. /&* -&) ,&* -&- Ralph Lauren 4.7% Bieey ;`gg 1&) 0&) 0&- 0&- n/a 0&- L'Occitane18.0% Kafilg 3.3% Average 5.9% 5.9% 6.0% 5.5% 5.1% 5.6% Beiersdorf17.6% Chow Tai Fook 2.0% Median 6.1% 5.9% 6.0% 5.7% 5.2% 5.6% Shiseido10.3% Hengdeli 0.8% Maximum 12.4% 9.6% 9.3% 8.7% 7.0% 8.5% Minimum (1.6%) 1.1% 0.8% 0.8% 0.9% 0.8% Source: Data based on consensus of several brokers reports for each company. Estimated data have not been derived from internal insights. The luxury and cosmetics financial factbook 2016
 Luxury and Cosmetic Financial Factbook Page 16 Page 18