
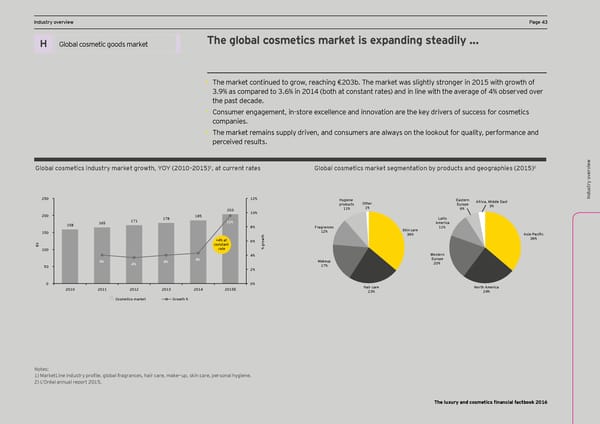
DCF and vIndustry oaluation pverview arameters PPage 43age 43 Ex ec The global cosmetics market is expanding steadily … utiv Global luxury goods Title for section H Global cosmetic goods market e summary H X Welcome to the third edition of EY’s annual • TShae mles oaf irknedt cuostnrty pinulaeyd tero gs arroe ew, rxpeeacctheid tng €o g2r0o3w ab. Tt a hhe meaaltrhky ret wataes s, lelid bghty dly soturbolneg-deir igin 2t an0n1u5 wal gitrh gowrth rowath ote ffo r Financial Factbook for the luxury and cosmetics 3L’.O9% accits canoe ampnad Nred tatuo 3ra f.6ro% im Fn 2Y01114 (A tbo Foth aY1t c4Eo. nstant rates) and in line with the average of 4% observed over DCF and v p the past decade. ar X Increased demand through innovative products will cater to underserved emerging markets. sector. Lhe >actbooc combines financial • Consumer engagement, in-store excellence and innovation are the key drivers of success for cosmetics ame data, insight from EY’s global team of sector X aluation Introduction of eco-friendly, sustainable and naturally derived beauty products and cosmetics will stimulate t er specialists and opinions of external experts. companies. s demand in established geographies. • Lhe marcet remains smpplq drinen, and consmmers are aloaqs on the loocomt for imalitq, performance and Titles for charts perceived results. Indusw ) 2 ?lgZal cgseelics indmsljy eajcel _jgol`$ QGQ *()(Ç*()-! , at current rates ?lgZal cgseelics eajcel se_eenlalign Zy pjgdmcls and _eg_jap`ies *()-! try oervie v v ervietry o w Indus 250 12% Hygiene Other Eastern Africa, Middle East products 1% Europe 3% 203 11% 6% 200 185 10% 171 178 Latin 158 165 10% America 8% Fragrances 11% 150 12% Skin care Asia-Pacific and disMe 36% b +4% at 6% owth 36% thodology € constant gr claimer 100 rate % 4% Western 4% Europe 4% 4% 4% Makeup 20% 50 17% Titles for charts 2% 0 0% Hair care North America 2010 2011 2012 2013 2014 2015E 23% 24% and specific analyS Cosmetics market Growth % ample s election s e s Source: Data based on consensus of several brokers’ reports for each C Glo company. on Notes: t s act uss N)! Eotesa:rMceartkDeit cne iapnitdamlizsattriq pon irs bofialsee, gd olon a obal fner-amgornatnh acevse, hragae air cs oarf De, meceamcebeÈr 2mp0, s12c.i n care, personal hqgiene. ary The 2012 growth corresponds to the sales growth rate between FY11A and FY12A/E. 2) L’Oréal annual report 2015. The luxury and cosmetics financial factbook 2016
 Luxury and Cosmetic Financial Factbook Page 44 Page 46