
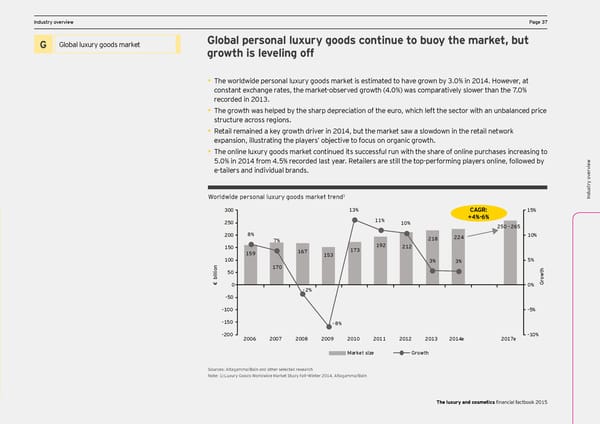
DCF and vIndustry oaluation pverview arameters PPage 37age 37 Ex ec Global personal luxury goods continue to buoy the market, but utiv Global luxury goods Title for section H Global luxury goods market e summary G growth is leveling off • The worldwide personal luxury goods market is estimated to have grown by 3.0% in 2014. However, at X Welcome to the third edition of EY’s annual Sales of industry players are expected to grow at a healthy rate, led by double-digit annual growth rate for constant exchange rates, the market-observed growth (4.0%) was comparatively slower than the 7.0% DCF and v Financial Factbook for the luxury and cosmetics L’Occitane and Natura from FY11A to FY14E. s recorded in 2013. p X ar er Increased demand through innovative products will cater to underserved emerging markets. aluationt sector. The Factbook combines financial • The growth was helped by the sharp depreciation of the euro, which left the sector with an unbalanced price ame data, insight from EY’s global team of sector X aluation ame Introduction of eco-friendly, sustainable and naturally derived beauty products and cosmetics will stimulate t ar structure across regions. er specialists and opinions of external experts. s DCF and vp demand in established geographies. • Retail remained a key growth driver in 2014, but the market saw a slowdown in the retail network expansion, illustrating the players’ objective to focus on organic growth. Titles for charts • The online luxury goods market continued its successful run with the share of online purchases increasing to 5.0% in 2014 from 4.5% recorded last year. Retailers are still the top-performing players online, followed by Indusw e-tailers and individual brands. try oervie v v ervietry o 1 w Worldwide personal luxury goods market trend Indus 300 13% 15% 250 11% 10% 250-265 200 8% 10% and disMe 7% 218 224 thodology 150 159 167 173 192 212 claimer 153 n 100 170 3% 3% 5% o h Titles for charts i t l 50 l i w b o r € 0 0% G -2% and specific analyS -50 ample s -100 -5% election -150 -8% s e s -200 2006 2007 2008 2009 2010 2011 2012 2013 2014e 2017e -10% Market size Growth Source: Data based on consensus of several brokers’ reports for each C Glo company. Sources: Altagamma/Bain and other selected research on t s act uss Notes:Market capitalization is based on a one-month average as of December 2012. Note: 1) Luxury Goods Worldwide Market Study Fall–Winter 2014, Altagamma/Bain ary The 2012 growth corresponds to the sales growth rate between FY11A and FY12A/E. The luxury and cosmetics financial factbook 2015
 Seeking sustainable growth - The luxury and cosmetics financial factbook Page 38 Page 40