
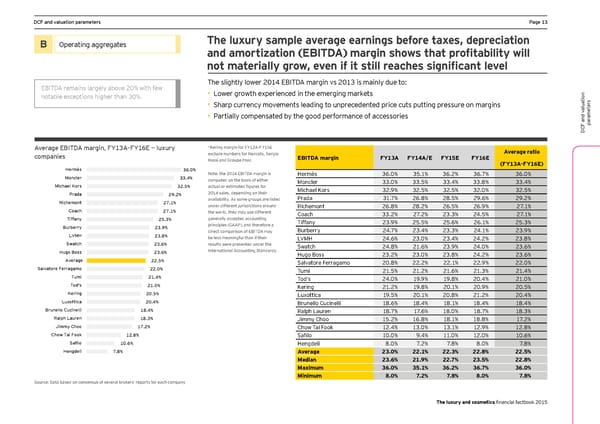
DCF and valuation parameters Page 13 B Operating aggregates The luxury sample average earnings before taxes, depreciation and amortization (EBITDA) margin shows that profitability will not materially grow, even if it still reaches significant level EBITDA remains largely above 20% with few The slightly lower 2014 EBITDA margin vs 2013 is mainly due to: • Lower growth experienced in the emerging markets notable exceptions higher than 30%. s • Sharp currency movements leading to unprecedented price cuts putting pressure on margins er aluationt • Partially compensated by the good performance of accessories ame ar p DCF and v Average EBITDA margin, FY13A–FY16E — luxury *Kering margin for FY12A-FY15E Average ratio companies exclude numbers for Redcats, Sergio EBITDA margin FY13A FY14A/E FY15E FY16E Rossi and Groupe Fnac (FY13A-FY16E) Hermès 36.0% Note: the 2014 EBITDA margin is Hermès 36.0% 35.1% 36.2% 36.7% 36.0% Moncler 33.4% computed on the basis of either Moncler 33.0% 33.5% 33.4% 33.8% 33.4% Michael Kors 32.5% actual or estimated figures for Michael Kors 32.9% 32.5% 32.5% 32.0% 32.5% Prada 29.2% 2014 sales, depending on their Richemont 27.1% availability. As some groups are listed Prada 31.7% 26.8% 28.5% 29.6% 29.2% under different jurisdictions around Richemont 26.8% 28.2% 26.5% 26.9% 27.1% Coach 27.1% the world, they may use different Coach 33.2% 27.2% 23.3% 24.5% 27.1% Tiffany 25.3% generally accepted accounting Tiffany 23.9% 25.5% 25.6% 26.1% 25.3% Burberry 23.9% principles (GAAP), and therefore a direct comparison of EBITDA may Burberry 24.7% 23.4% 23.3% 24.1% 23.9% LVMH 23.8% be less meaningful than if their LVMH 24.6% 23.0% 23.4% 24.2% 23.8% Swatch 23.6% results were presented under the Swatch 24.8% 21.6% 23.9% 24.0% 23.6% Hugo Boss 23.6% International Accounting Standards. Hugo Boss 23.2% 23.0% 23.8% 24.2% 23.6% Average 22.5% Salvatore Ferragamo 20.8% 22.2% 22.1% 22.9% 22.0% Salvatore Ferragamo 22.0% Tumi 21.5% 21.2% 21.6% 21.3% 21.4% Tumi 21.4% Tod’s 24.0% 19.9% 19.8% 20.4% 21.0% Tod's 21.0% Kering 21.2% 19.8% 20.1% 20.9% 20.5% Kering 20.5% Luxottica 19.5% 20.1% 20.8% 21.2% 20.4% Luxottica 20.4% Brunello Cucinelli 18.6% 18.4% 18.1% 18.4% 18.4% Brunello Cucinelli 18.4% Ralph Lauren 18.7% 17.6% 18.0% 18.7% 18.3% Ralph Lauren 18.3% Jimmy Choo 15.2% 16.8% 18.1% 18.8% 17.2% Jimmy Choo 17.2% Chow Tai Fook 12.4% 13.0% 13.1% 12.9% 12.8% Chow Tai Fook 12.8% Safilo 10.0% 9.4% 11.0% 12.0% 10.6% Safilo 10.6% Hengdeli 8.0% 7.2% 7.8% 8.0% 7.8% Hengdeli 7.8% Average 23.0% 22.1% 22.3% 22.8% 22.5% Median 23.6% 21.9% 22.7% 23.5% 22.8% Maximum 36.0% 35.1% 36.2% 36.7% 36.0% Minimum 8.0% 7.2% 7.8% 8.0% 7.8% Source: Data based on consensus of several brokers’ reports for each company The luxury and cosmetics financial factbook 2015
 Seeking sustainable growth - The luxury and cosmetics financial factbook Page 14 Page 16